Work
Ongoing
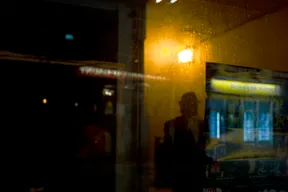
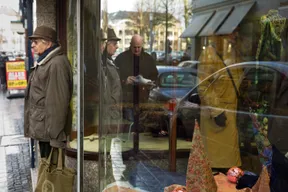
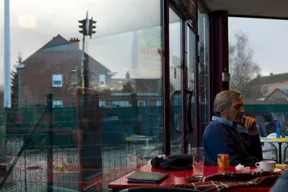
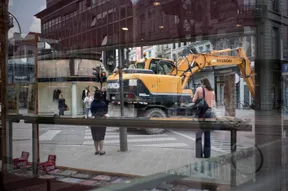
Familiar Frictions
Photographs of routine situations that feel both familiar and foreign, and an enquiry into why they register (started 2026).
Visualisation for Adaptive Planning
Interactive visual analysis of temporal models of supply, demand, and deficit (started 2026).
Information Structure for Dynamic Workflows
Visual representations of complex processes, including loops, to support users’ mental model (started 2025).
2026
Collected Works
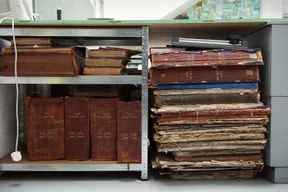
Private and institutional collections show collecting as a valuable cultural practice, and as a lens on the habits that drive consumer culture and environmental degradation.
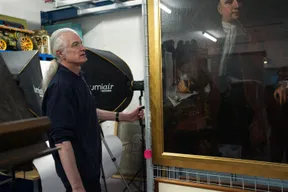
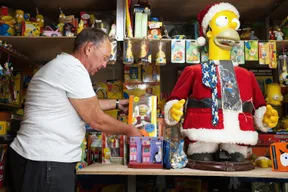
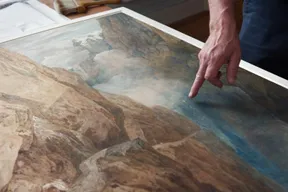
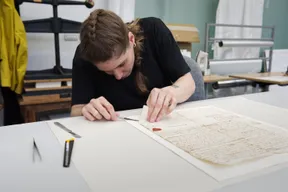
2025
Sediments
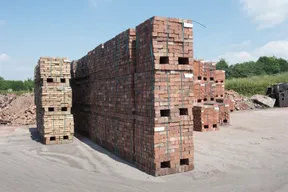
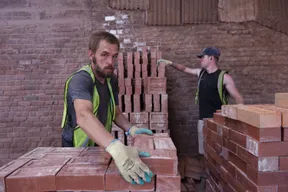
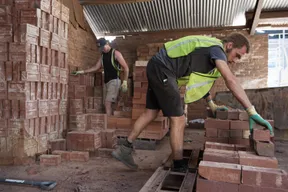
At a 150-year-old Cumbrian brickworks, brickmaking’s durable, recyclable product, its labour and its heritage are weighed against the coal burnt in the kiln and the land quarried for shale.

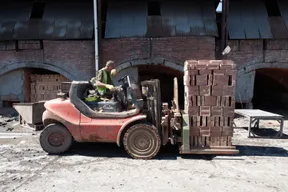
- exhibitionArtist Lab Exhibition, Signal Film & Media Gallery, Barrow-in-Furness, 28 Nov 2025–31 Jan 2026
- pressReview, Landscape & Protest: Signal Artist Lab, Corridor 8, 2025
- exhibitionSelected work, Chris Killip: Askam-in-Furness, Signal Film & Media Gallery, Barrow-in-Furness, 19 Sept–1 Nov 2025
- publicationSelected work, festival catalogue, FORMAT International Photography Festival, Derby, March 2025
- exhibitionSelected work, East Meets West Exhibition, FORMAT International Photography Festival, Derby, March 2025
2024
Intervention and Renewal
On an organic dairy farm in Cumbria, three generations show that farming can pay and still sustain biodiversity, through hedgerows, habitat creation, and pesticide-free stewardship of the waterways.
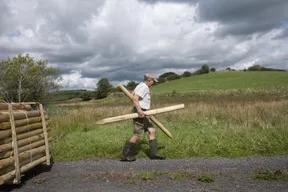
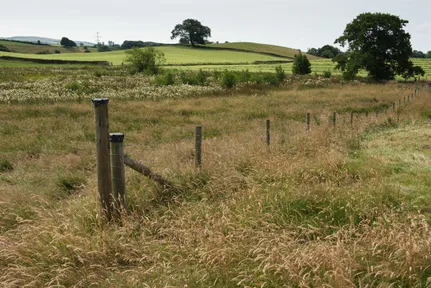
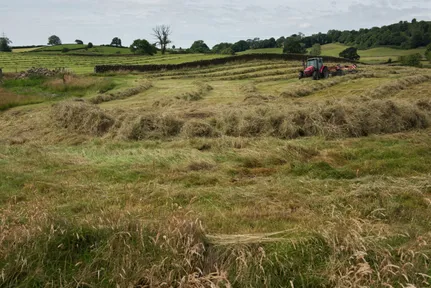
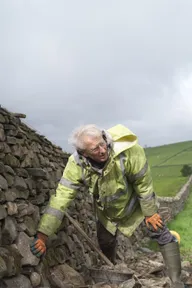
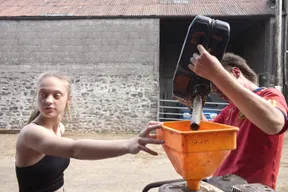
- shortlistSelected work, shortlisted for Photo with a story contest: Agrobiodiversity as roots of resilience, Alliance of Bioversity International and CIAT, 2026
- pressReview, We Feed the UK: Heritage, Nature and Regenerative Farming in Photographs, Arts (MDPI), 2026
- publicationWe Feed the UK, Papadakis Publisher, 2025
- pressSelected work, Farmers fighting the climate emergency, The Guardian, June 2025
- exhibitionWe Feed the UK, Royal Photographic Society, Bristol, 3 April–22 June 2025
- exhibitionIntervention and Renewal, Abbot Hall, Kendal, 28 Sept 2024–19 April 2025
- publicationTilt Zine no. 24, Open Eye Gallery, Liverpool, 2024
- exhibitionIntervention and Renewal, Open Eye Gallery, Liverpool, 8 Feb–31 March 2024
2023
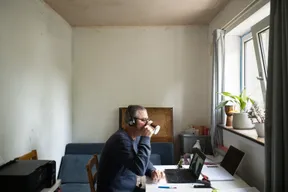
Work from Home
The rooms where screens and cables compete with domestic life show people adapting to working at home. Many find it liberating, but the casual surroundings also hint at how precarious employment has become.
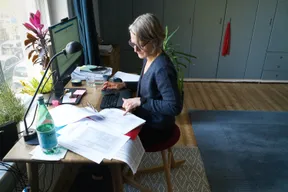


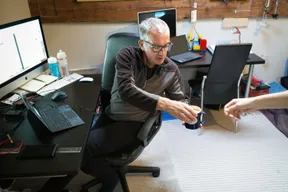
- shortlistSelected work, shortlisted for International Photography Exhibition 166, Royal Photographic Society, 2024
- exhibitionWork from Home, The Dukes, Lancaster, 30 April–14 June 2024
- exhibitionWork from Home, The Carlton Club, Manchester, 26 Oct–14 Nov 2023
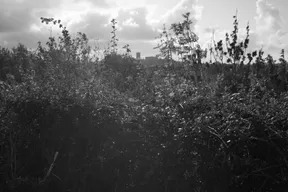
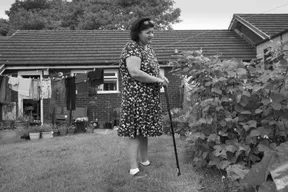
Dealing with the Damage
A research scientist and a bank employee who fled the Syrian Civil War now tend an organic garden behind their council house in Britain.
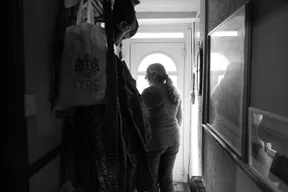
Living with the Knowledge
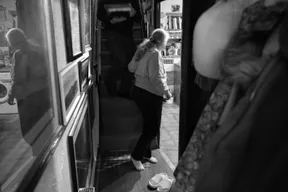
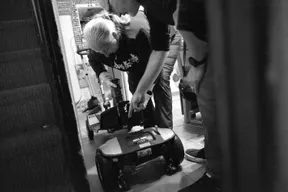
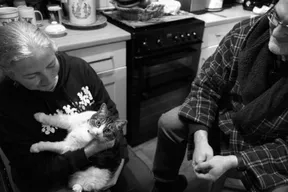
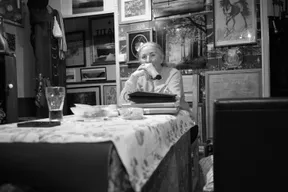
A couple face early-onset Parkinson’s disease and a benefits system they find antagonistic, held together by the knowledge that the condition will worsen, and by mutual devotion.
2022
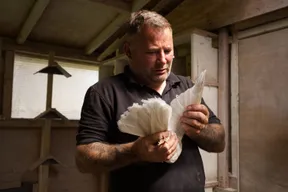
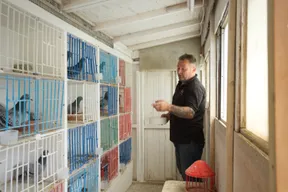
Portrait of a Pigeon Racer
A racing pigeon released hundreds of kilometres from its loft flies straight back. For its Lancashire keeper, that improbable return reaffirms home as the place where aspiration is nurtured.



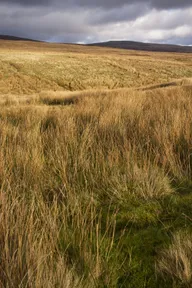
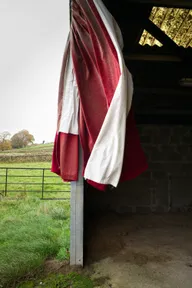
Below Grit Fell
Scenes from farms below a lonely Lancashire fell illustrate the many ways people relate to the place that shapes their lives.
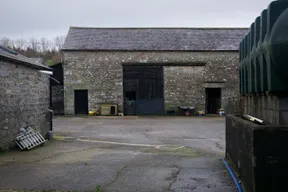
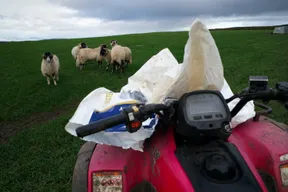
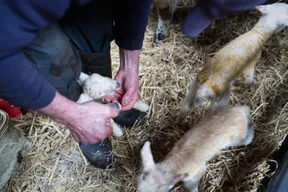
- shortlistSelected work, shortlisted for International Photography Exhibition 164, Royal Photographic Society, 2022
- pressFeatured, Photomonitor, 2022
- exhibitionBelow Grit Fell, The Storey, Lancaster, Sept–Oct 2022
2021
Boundary Condition
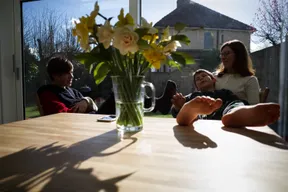
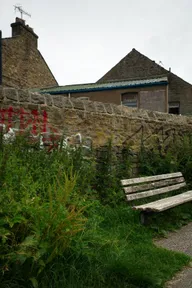
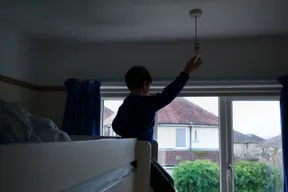
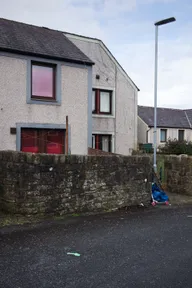
Fragments of life, marked by boundaries, show the private and the public crossing into each other.

2020
Out of Place
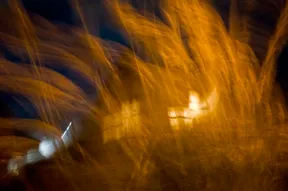
These pictures were made on night runs, with no time to compose, through the aftermath of the Brexit referendum. They catch an unstable Britain, and the small freedom of running, which politics cannot take away.
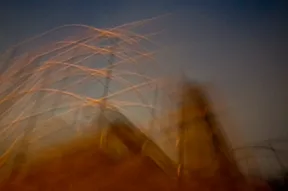
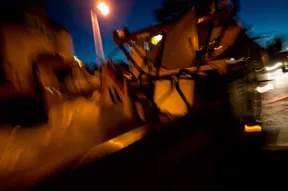
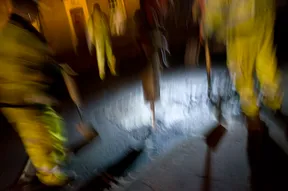

- publicationOut of Place, Self-published, edition of 60, 2020
2017
Common Ground
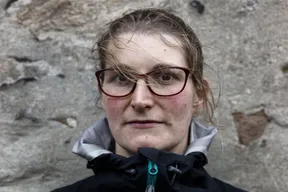
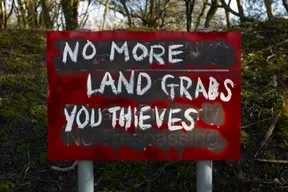
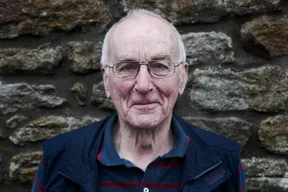
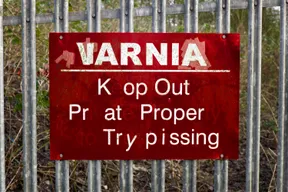
People at a community centre with an uncertain future are set beside the defaced no-trespassing notices of newly fenced scrubland. Together they ask who has a claim on shared space, and who decides.
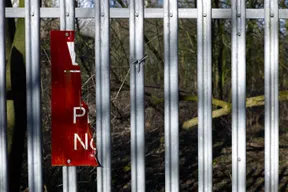
- publicationCommon Ground, Fast Foot Press, Lancaster, 2017
Visualisation of Cell Behaviour
Cell lineages are studied to understand how cells differentiate and how anticancer drugs act, but they are too intricate to read. Summarising many at once, with their variation from the average, makes them readable. A Leverhulme Early Career Fellowship at the University of Leeds supported the work, done with biologists at Cardiff University School of Medicine.
- publicationA survey of visualization for live cell imaging, Computer Graphics Forum, 36(1): 46–63, 2017
- publicationCell lineage visualisation, Computer Graphics Forum, 34(3): 21–30, 2015
2016
2015
Visualisation of Parameter Space
What an image analysis algorithm finds depends on its settings, and showing how the output responds to them lets an expert choose the settings with understanding. The research was done at the University of Leeds, in collaboration with the Broad Institute of MIT and Harvard.
- publicationVisual parameter optimisation for biomedical image processing, BMC Bioinformatics, 16(Suppl 11): S9, 2015
- publicationVisualization of parameter space for image analysis, IEEE Transactions on Visualization and Computer Graphics, 17(12): 2402–2411, 2011
2014
Visualisation of Multivariate Networks
Most graph visualisation shows only how things connect, but clustering nodes and edges by the data they carry lets an analyst see which node attributes switch on which kinds of connection. The approach is an offshoot of doctoral research at Eindhoven University of Technology.
- publicationTasks for multivariate network analysis, Multivariate Network Visualization, LNCS 8380, Springer, pp. 77–95, 2014
- publicationVisual inspection of multivariate graphs, Computer Graphics Forum, 27(3): 967–974, 2008
2009
Visualisation of Transition Systems
Clustering a system’s states by their attributes gives insight into its behaviour, even when the graph of states and transitions exceeds 50,000 nodes, as it does for an industrial wafer stepper. It was the focus of doctoral research at Eindhoven University of Technology.
- publicationWhat does the user want to see? What do the data want to be?, Information Visualization, 8(3): 153–166, 2009
- thesisVisualization of state transition graphs, PhD thesis, Eindhoven University of Technology, 2008
- publicationAssessing state spaces using Petri net synthesis and attribute-based visualization, Transactions on Petri Nets and Other Models of Concurrency I, LNCS 5100, Springer, pp. 152–171, 2008
- publicationMultiple views on system traces, IEEE Pacific Visualization Symposium, pp. 95–102, 2008
- publicationBridging the semantic gap: visualizing transition graphs with user-defined diagrams, IEEE Computer Graphics and Applications, 27(5): 58–66, 2007
- publicationVerified design of an automated parking garage, Formal Methods: Applications and Technology (PDMC 2006), LNCS 4346, Springer, pp. 165–180, 2007
- publicationVisual analysis of multivariate state transition graphs, IEEE Transactions on Visualization and Computer Graphics, 12(5): 685–692, 2006
- publicationMultidimensional visualization of transition systems, Ninth International Conference on Information Visualisation, pp. 323–328, 2005
2005
Visualisation of Ontologies
An ontology base, a set of binary fact types, is too large to read as text, but ordering and clustering it in a visual overview reveals structure that the text hides. It came out of MSc research at the Vrije Universiteit Brussel.
- publicationVisual analysis for ontology engineering, Journal of Visual Languages & Computing, 16(4): 359–381, 2005
- publicationLexon visualization: visualizing binary fact types in ontology bases, Eighth International Conference on Information Visualisation, pp. 58–63, 2004